Table of Contents
Surface Area and Contamination
Much of the contamination within sediment is due to the adsorption of waterborne contamination onto the surface of the particles within the sediment.
Smaller particles have a higher area per unit weight of material, so for 1litre of material (10cm x 10cm x 10cm cube with a surface area of 0.06m2) broken up into different size spherical particles:
- 1 cm diameter spheres: Total surface area ≈ 0.6m2
- 1 mm diameter spheres: Total surface area ≈ 6m2
- 1 micrometer diameter spheres: Total surface area ≈ 6,0000m2
For sediments the particle size ranges from gravels of many millimetres to silts of only a few microns in size, meaning that the surface of a predominantly gravel sediment will be orders of magnitude smaller than a predominantly silt sediment.
Contaminants which are adsorbed require surface to be adsorbed to, so the higher the surface area, the more contaminant will be contained in the sediment.
The level of contamination is controlled by many factors, local contamination release, flow of the river etc.. So the role of surface area can be difficult to determine in the chemical analyses of different sediments.
The overspill from dredging barges and the resuspension which happens during dredging is mainly composed of the finest particles within the sediment. The finest particles will contain the highest levels of hydrophobic contaminants i.e. PCBs and many of the PAHs particularly the high molecular weight ones.
It should also be born in mind that PCBs and other long lived organic contaminants bioaccumulate in seals through their food sources and then passes to the pup during lactation. While humans do not eat a 100% diet of contaminated food sources, we should be concerned that the discovery that seal pups found dead or deing on the River Tees have also shown high levels of PCBs, as our exposure to the Tees environment will be exposing us to the same contaminants.
19th October 2023 - MLA/2015/00088 - Mid-licence sampling
The set of samples taken as part of the mid-licence sampling of the River Tees dredge disposal licence show a strong correlation between relative total surface area and the level of polycyclic aromatic hydrocarbon contamination. MMO_Results_ - MAR02085 UPDATED.xlsm - MLA/2015/00088 19th October 2023. Explore using the Sediment Data Explorer - SDE - MAR02085
Particle Size
While the size of individual particles is a single value, a particle size distribution can be displayed in many different ways. If you are interested in mass of material then it is appropriate to display the fraction of the weight that is within a certain particle size range. However, as contaminants are adsorbed to the surface of particles, the weight particle size distribution is not appropriate to understand how much surface area is available to adsorb contaminants. Instead the particle size should be displayed as the fraction of surface area which is within a certain particle size range.
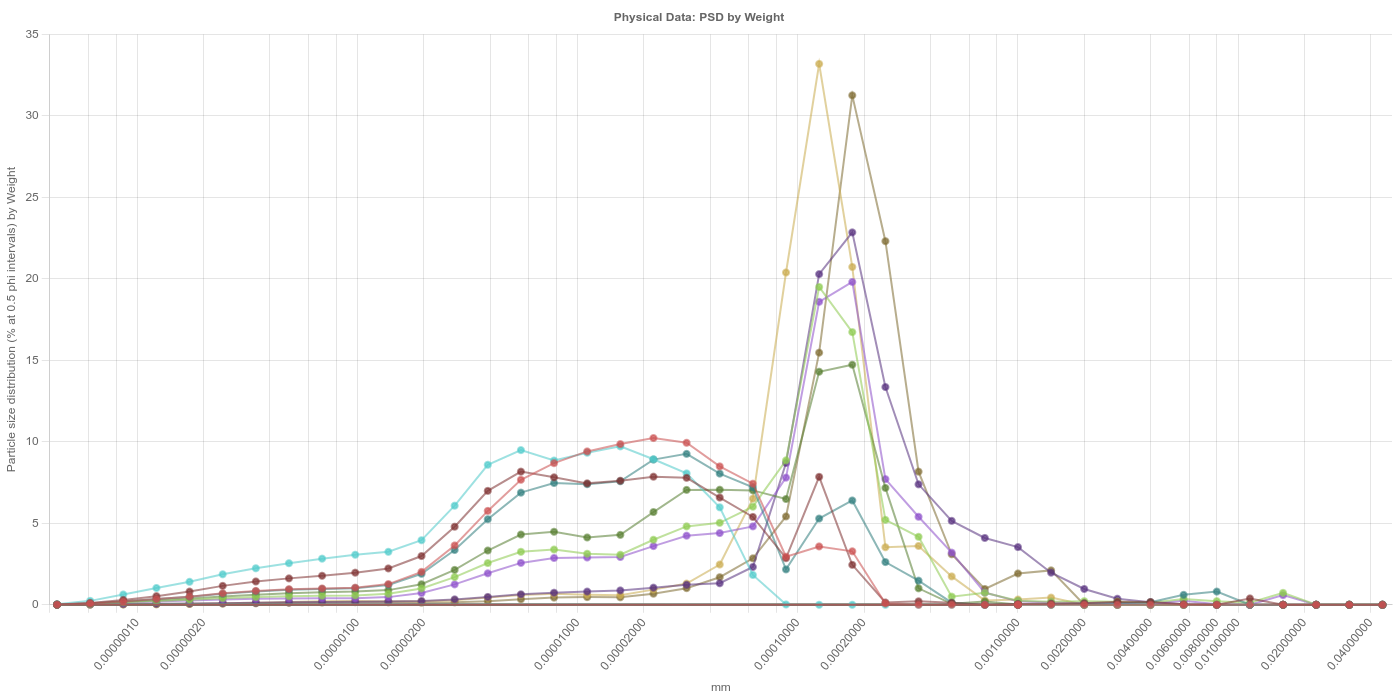
By weight
The weight particle size distribution shows that how the different sediments are composed of a mixture of largely sand and silt. It also shows that some sediments are mainly slit, while some are mainly sand.
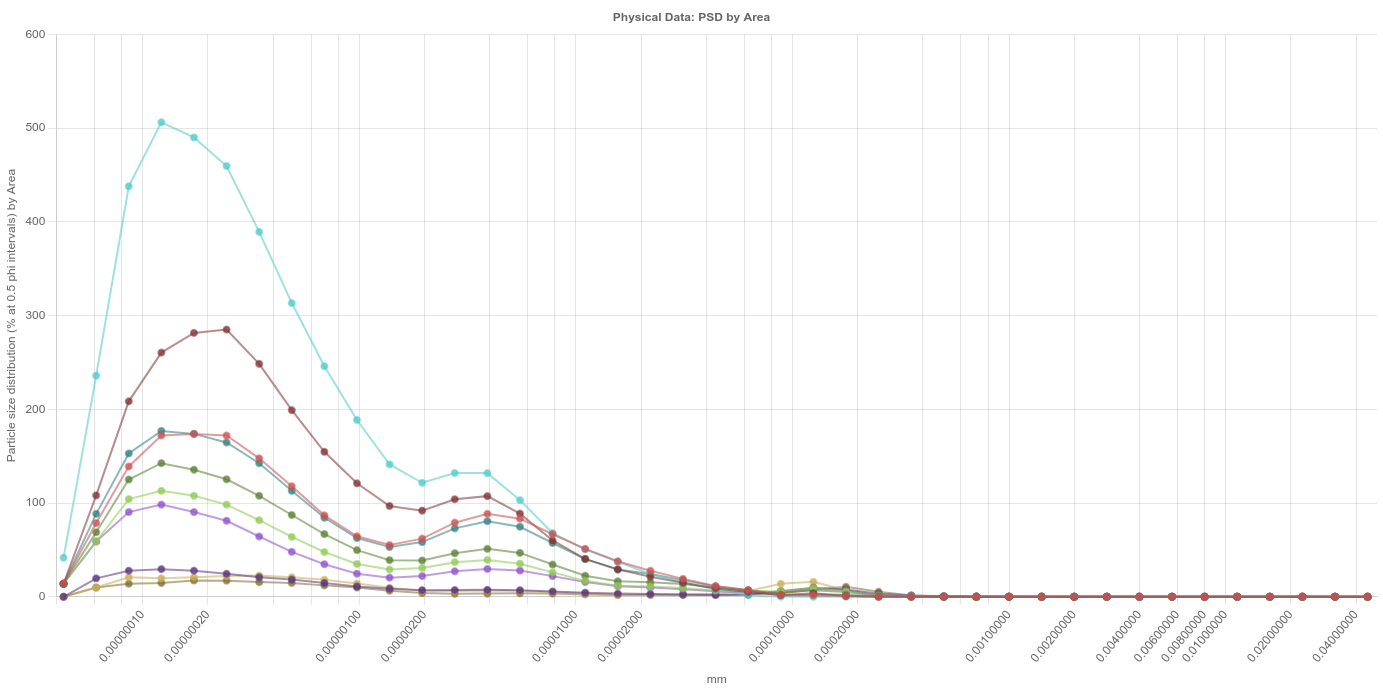
By area
Rather than displaying a particle size distribution in terms of percent of total area, by displaying it in units of area, it becomes how different the surface areas of the different sediments are.
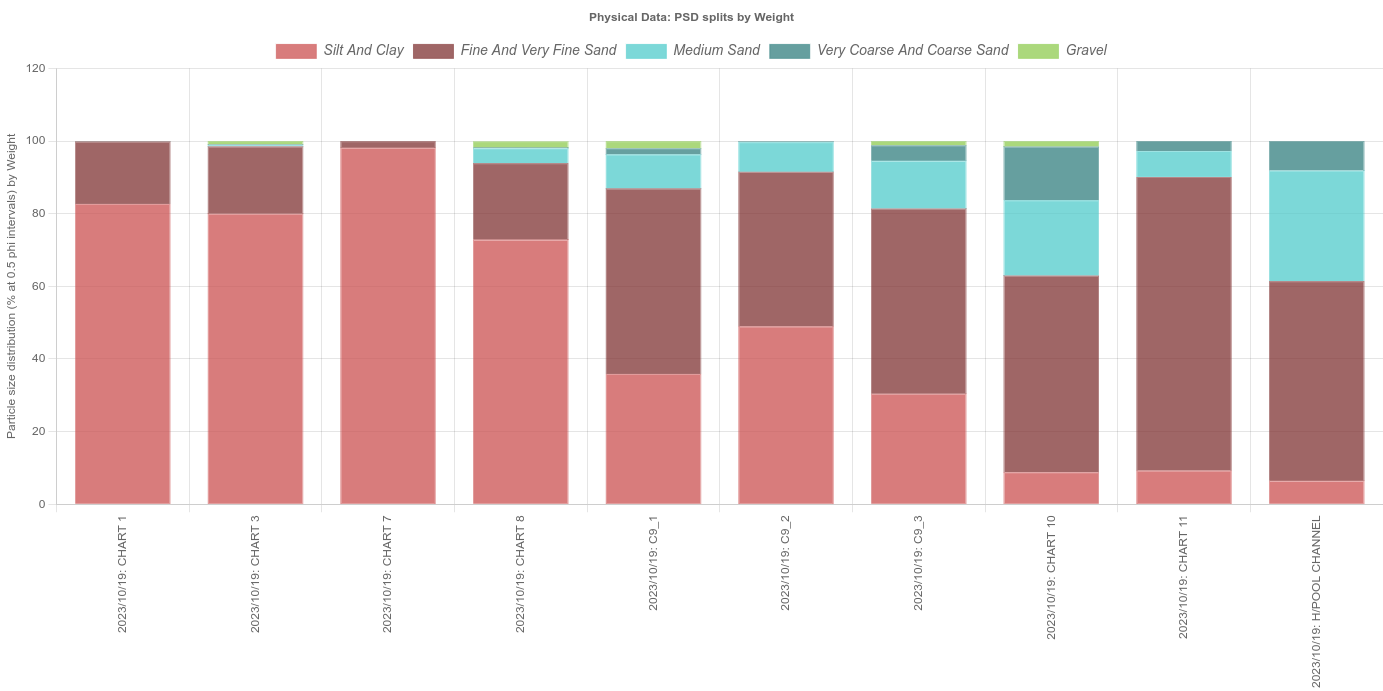
By type
The split of the sediments into types of particles by weight fraction shows the differing composition of the different sediments.
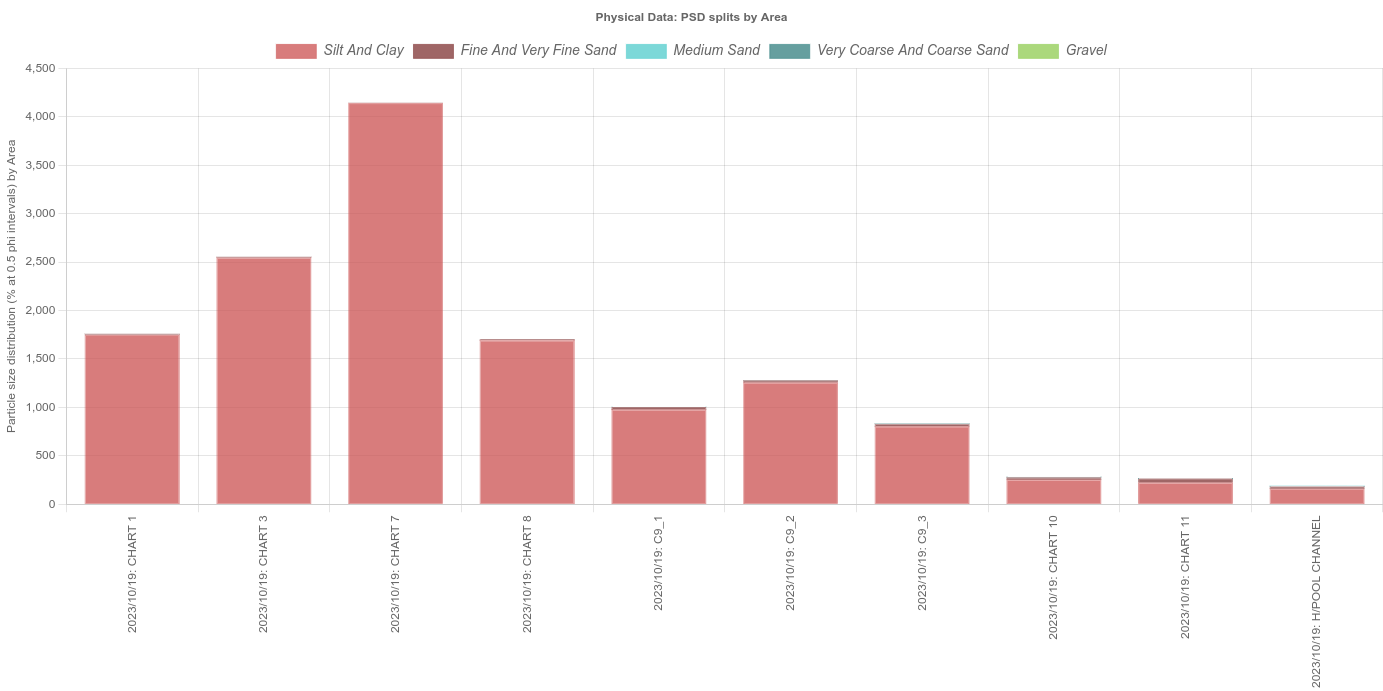
Total Surface Area
Displaying the split of the surface area by particle types, shows how the surface area is dominated by the silt fraction
Cumulative Particle Size Distributions
Plotting cumulative particle size distributions makes it clear how much the surface area is dominated by the smallest particles, the silt.
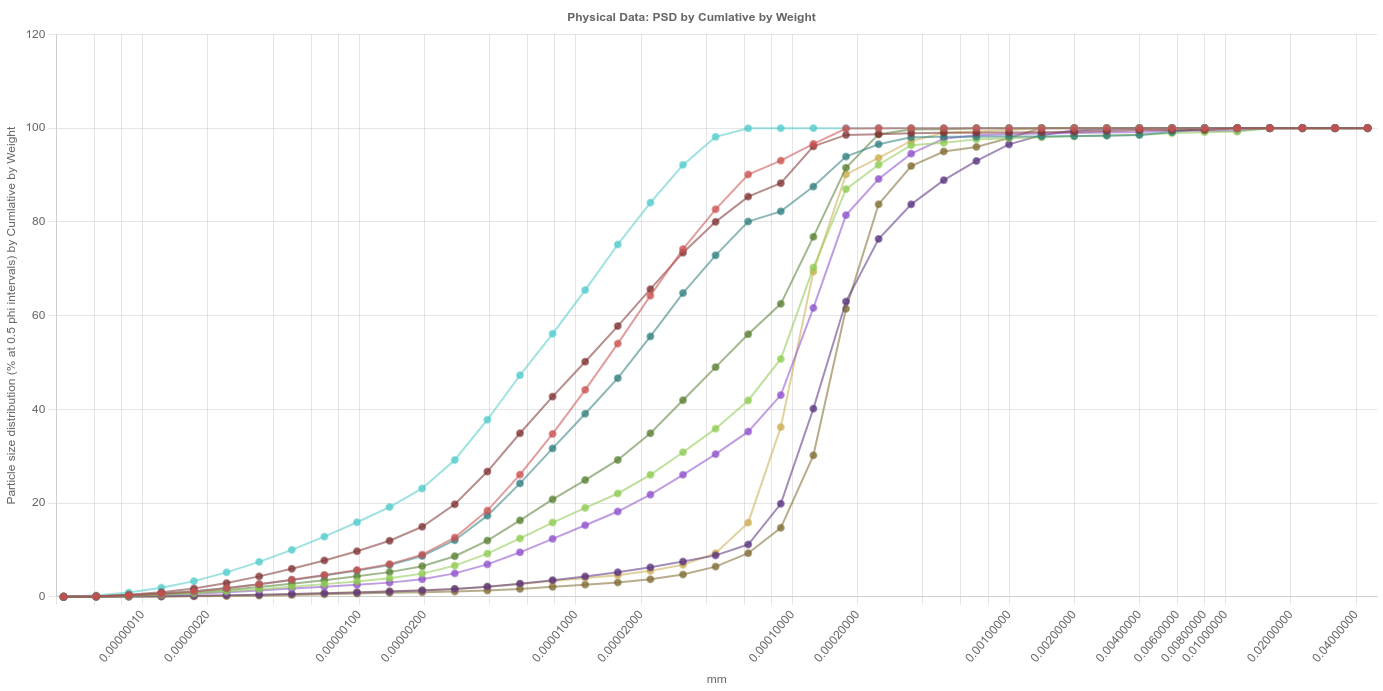
Particles below 1um in size account for less than 10% of the weight of the sediment in all but one sample.
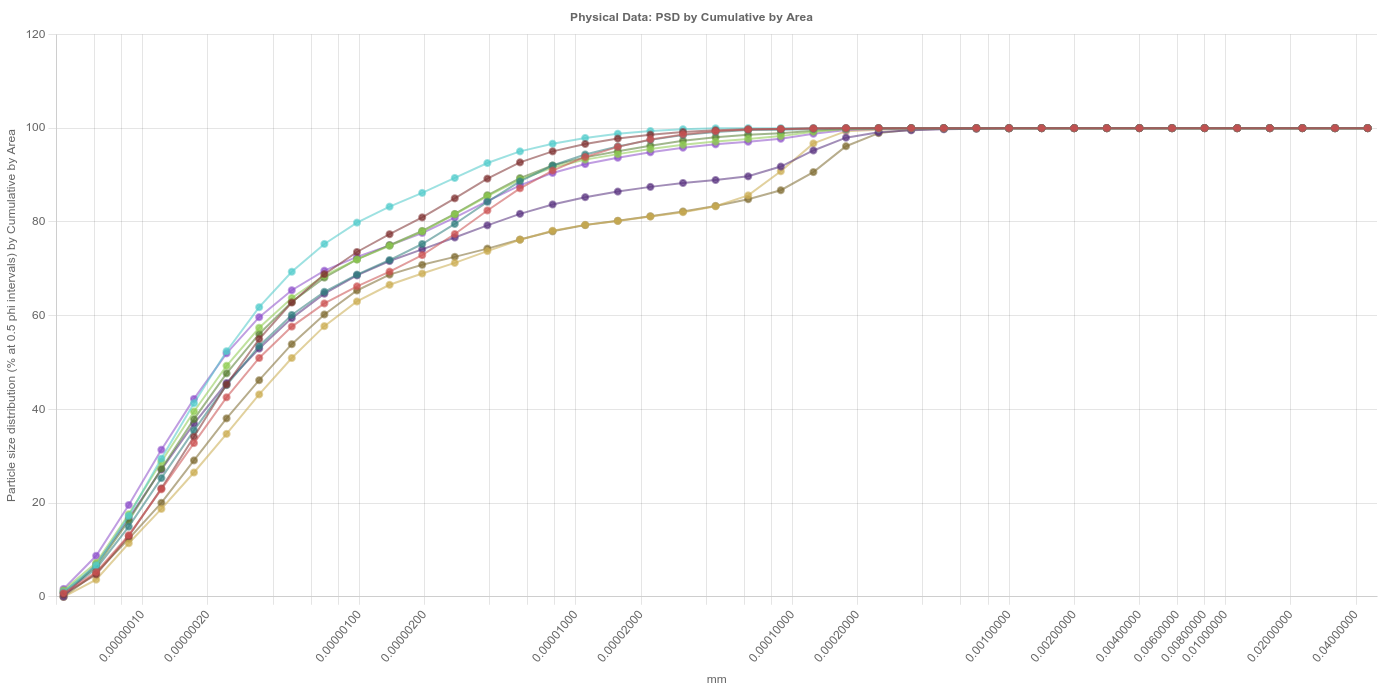
Particles less than 1um in size account for between 75 and 95% of the surface area of the sediment.
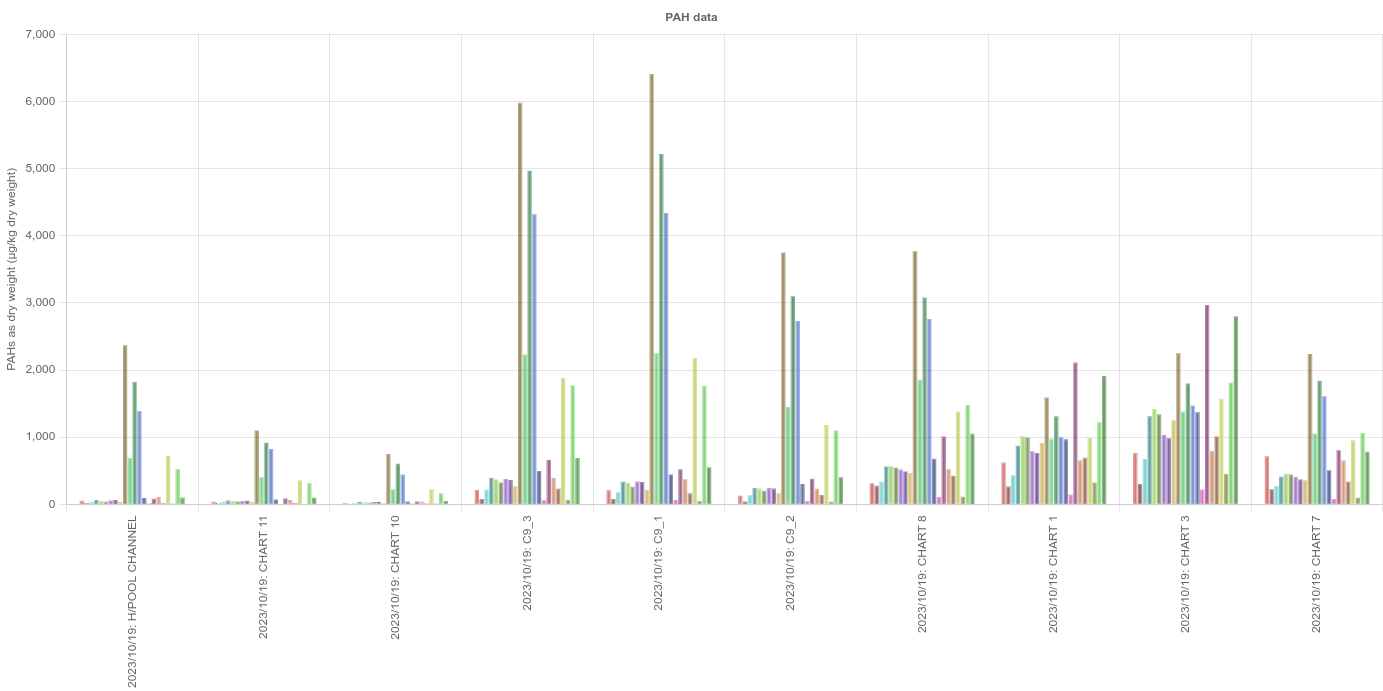
Polycyclic Aromatic Hydrocarbons
All the analysis carried out has ignored the sediment sample taken at the Chart 7 position, near to South Bank Quay, as this area had been extensively dredged to clean up after the spills and contamination of the River Bed which occurred during the construction of the new quay. This sample showed the highest total surface area being composed of almost entirely clay / silt and a relatively low level of contamination.
Teesworks - Recorded Contamination of Tees by Closed Bucket Dredging
Gorham-Test PAH Toxicity Measure
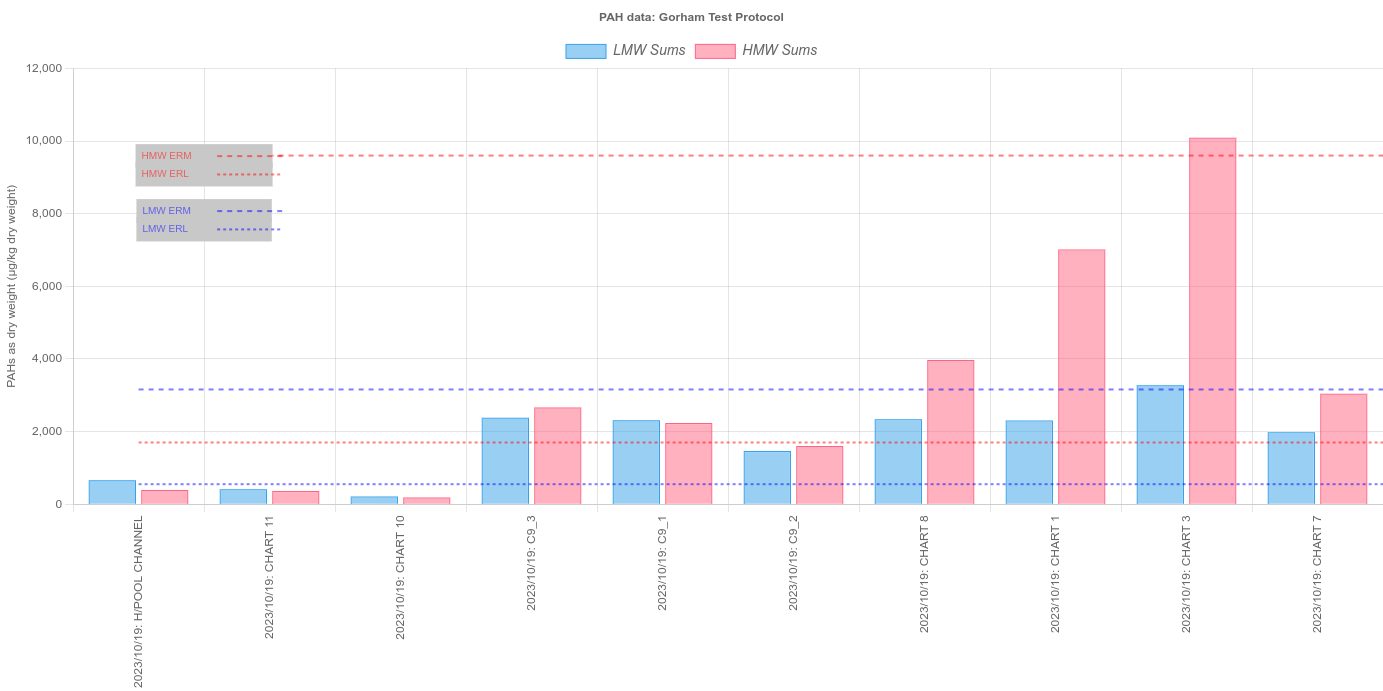
Aside from the sediment sample taken in Chart 7 area, there is a strong relationship between surface area and long term toxicity of the sediment due to high molecular weight PAHs.
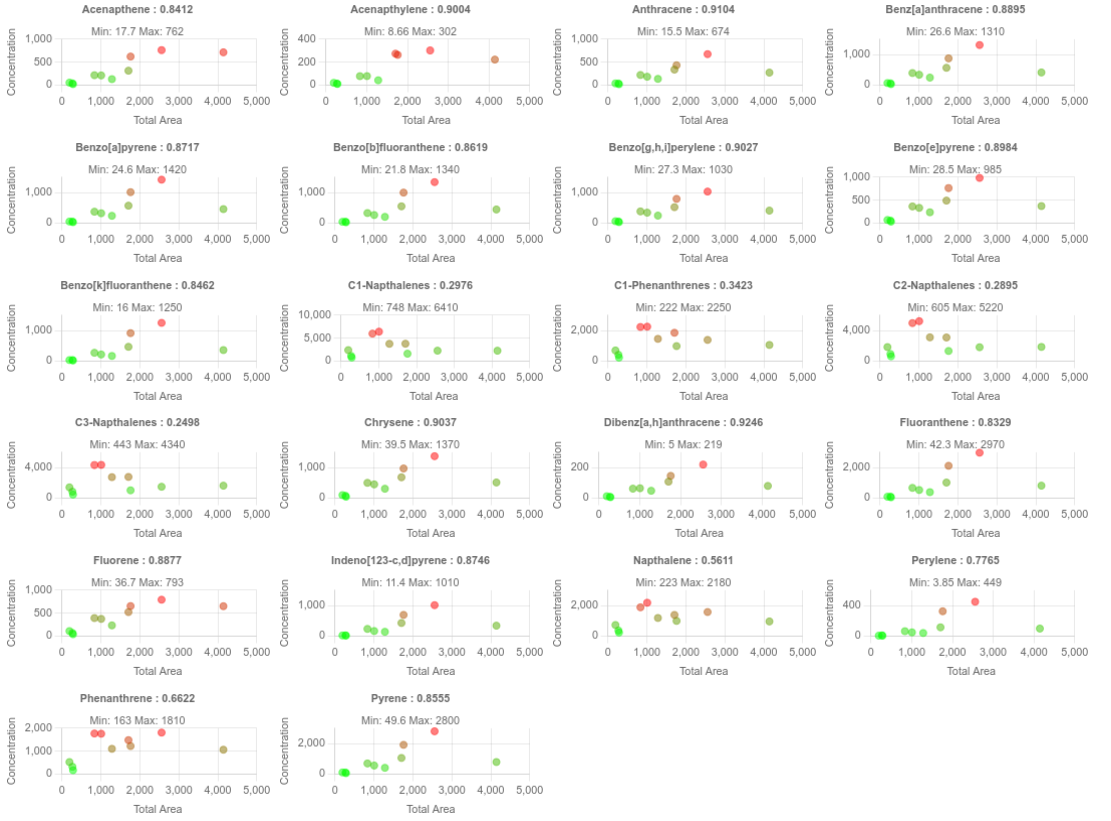
Role of Surface Area and Total Hydrocarbon Content on Individual PAHs
Graphical for many of the PAHs there is a visibly strong relationship between surface area and the measured level of PAH. Many PAHs are hydrophobic and are known to adsorb to mineral surfaces, it is also likely that many will be soluble in other hydrocarbon contamination present. So each PAH concentration was fitted to a linear function of total surface area and total hydrocarbon content.
This composite plot shows each PAH plotted against surface area, the chart title is the chemical name, followed by the R-squared values for the linear fit to total surface area and total hydrocarbon conent.
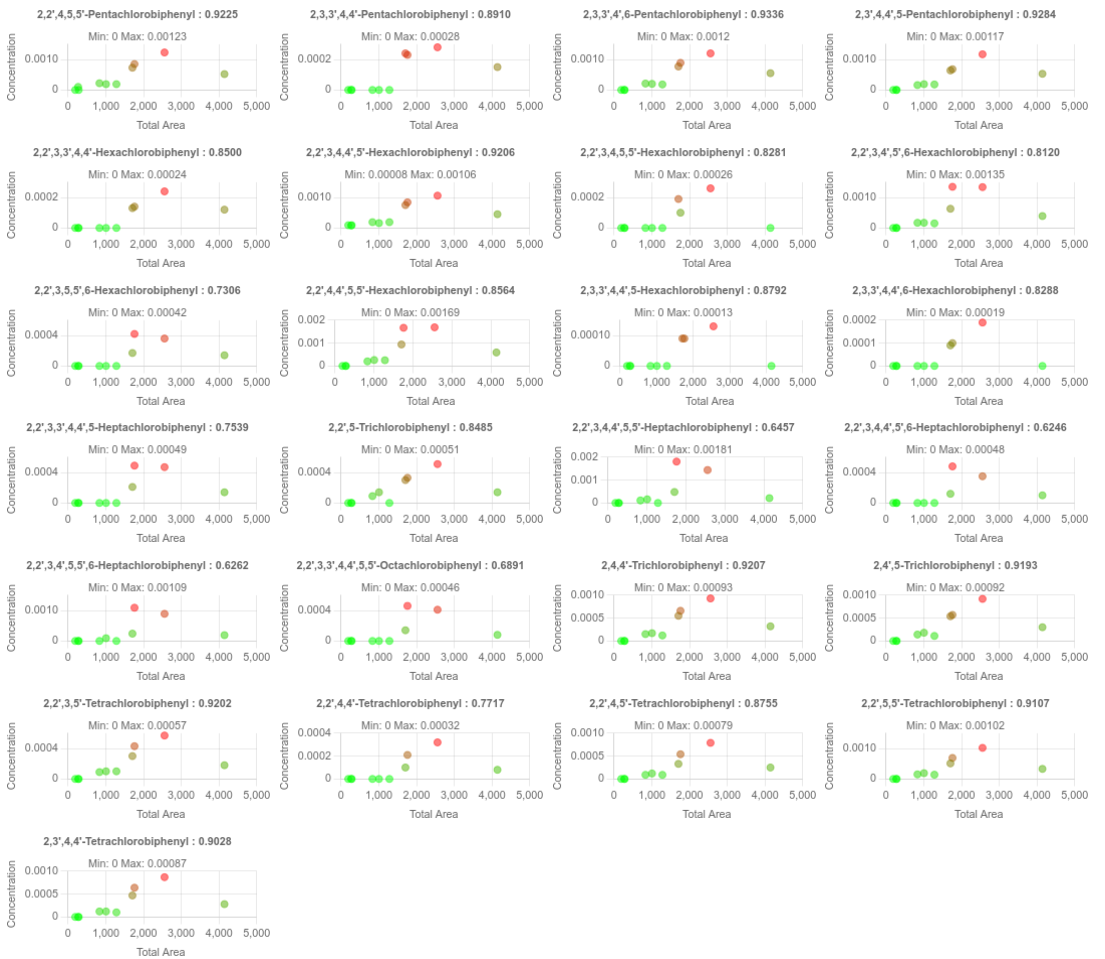
Role of Surface Area and Total Hydrocarbon Content on Individual PCBs
The same plots and fitting are reproduced for PCBs below:
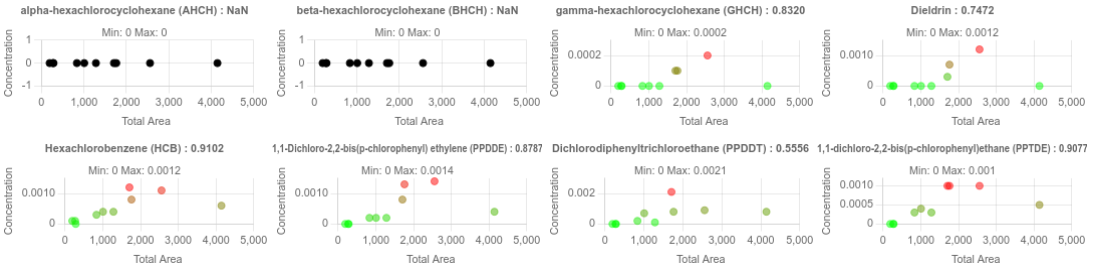
Role of Surface Area and Total Hydrocarbon Content on Individual Organochlorines
The same plots and fitting are reproduced for organochlorines below:
All PAHs
HMW PAHs


LMW PAHs


Other PAHs


